Plot with the regression coefficients' point estimates as dots with confidence interval whiskers and other statistical details included as labels.
Although the statistical models displayed in the plot may differ based on the class of models being investigated, there are few aspects of the plot that will be invariant across models:
The dot-whisker plot contains a dot representing the estimate and their confidence intervals (
95%is the default). The estimate can either be effect sizes (for tests that depend on theF-statistic) or regression coefficients (for tests witht-,chi^2-, andz-statistic), etc. The function will, by default, display a helpfulx-axis label that should clear up what estimates are being displayed. The confidence intervals can sometimes be asymmetric if bootstrapping was used.The label attached to dot will provide more details from the statistical test carried out and it will typically contain estimate, statistic, and p-value.
The caption will contain diagnostic information, if available, about models that can be useful for model selection: The smaller the Akaike's Information Criterion (AIC) and the Bayesian Information Criterion (BIC) values, the "better" the model is.
The output of this function will be a
{ggplot2}object and, thus, it can be further modified (e.g. change themes) with{ggplot2}.
Usage
ggcoefstats(
  x,
  statistic = NULL,
  conf.int = TRUE,
  conf.level = 0.95,
  digits = 2L,
  exclude.intercept = FALSE,
  effectsize.type = "eta",
  meta.analytic.effect = FALSE,
  meta.type = "parametric",
  bf.message = TRUE,
  sort = "none",
  xlab = NULL,
  ylab = NULL,
  title = NULL,
  subtitle = NULL,
  caption = NULL,
  only.significant = FALSE,
  point.args = list(size = 3, color = "blue", na.rm = TRUE),
  errorbar.args = list(height = 0, na.rm = TRUE),
  vline = TRUE,
  vline.args = list(linewidth = 1, linetype = "dashed"),
  stats.labels = TRUE,
  stats.label.color = NULL,
  stats.label.args = list(size = 3, direction = "y", min.segment.length = 0, na.rm =
    TRUE),
  package = "RColorBrewer",
  palette = "Dark2",
  ggtheme = ggstatsplot::theme_ggstatsplot(),
  ...
)
Arguments
- x
A model object to be tidied, or a tidy data frame from a regression model. Function internally uses
parameters::model_parameters()to get a tidy data frame. If a data frame, it must contain at the minimum two columns namedterm(names of predictors) andestimate(corresponding estimates of coefficients or other quantities of interest).- statistic
Relevant statistic for the model (
"t","f","z", or"chi") in the label. Relevant only ifxis a data frame.- conf.int
Logical. Decides whether to display confidence intervals as error bars (Default:
TRUE).- conf.level
Numeric deciding level of confidence or credible intervals (Default:
0.95).- digits
Number of digits for rounding or significant figures. May also be
"signif"to return significant figures or"scientific"to return scientific notation. Control the number of digits by adding the value as suffix, e.g.digits = "scientific4"to have scientific notation with 4 decimal places, ordigits = "signif5"for 5 significant figures (see alsosignif()).- exclude.intercept
Logical that decides whether the intercept should be excluded from the plot (Default:
FALSE).- effectsize.type
This is the same as
es_typeargument ofparameters::model_parameters(). Defaults to"eta", and relevant for ANOVA-like objects.- meta.analytic.effect
Logical that decides whether subtitle for meta-analysis via linear (mixed-effects) models (default:
FALSE). IfTRUE, input to argumentsubtitlewill be ignored. This will be mostly relevant if a data frame with estimates and their standard errors is entered.- meta.type
Type of statistics used to carry out random-effects meta-analysis. If
"parametric"(default),metafor::rma()will be used. If"robust",metaplus::metaplus()will be used. If"bayes",metaBMA::meta_random()will be used.- bf.message
Logical that decides whether results from running a Bayesian meta-analysis assuming that the effect size d varies across studies with standard deviation t (i.e., a random-effects analysis) should be displayed in caption. Defaults to
TRUE.- sort
If
"none"(default) do not sort,"ascending"sort by increasing coefficient value, or"descending"sort by decreasing coefficient value.- xlab
Label for
xaxis variable. IfNULL(default), variable name forxwill be used.- ylab
Labels for
yaxis variable. IfNULL(default), variable name forywill be used.- title
The text for the plot title.
- subtitle
The text for the plot subtitle. The input to this argument will be ignored if
meta.analytic.effectis set toTRUE.- caption
The text for the plot caption. This argument is relevant only if
bf.message = FALSE.- only.significant
If
TRUE, only stats labels for significant effects is shown (Default:FALSE). This can be helpful when a large number of regression coefficients are to be displayed in a single plot.- point.args
A list of additional aesthetic arguments to be passed to the
ggplot2::geom_point().- errorbar.args
Additional arguments that will be passed to
geom_errorbarh()geom. Please see documentation for that function to know more about these arguments.- vline
Decides whether to display a vertical line (Default:
"TRUE").- vline.args
Additional arguments that will be passed to
geom_vlinegeom. Please see documentation for that function to know more about these arguments.- stats.labels
Logical. Decides whether the statistic and p-values for each coefficient are to be attached to each dot as a text label using
{ggrepel}(Default:TRUE).- stats.label.color
Color for the labels. If set to
NULL, colors will be chosen from the specifiedpackage(Default:"RColorBrewer") andpalette(Default:"Dark2").- stats.label.args
Additional arguments that will be passed to
ggrepel::geom_label_repel().- package, palette
Name of the package from which the given palette is to be extracted. The available palettes and packages can be checked by running
View(paletteer::palettes_d_names).- ggtheme
A
{ggplot2}theme. Default value istheme_ggstatsplot(). Any of the{ggplot2}themes (e.g.,ggplot2::theme_bw()), or themes from extension packages are allowed (e.g.,ggthemes::theme_fivethirtyeight(),hrbrthemes::theme_ipsum_ps(), etc.). But note that sometimes these themes will remove some of the details that{ggstatsplot}plots typically contains. For example, if relevant,ggbetweenstats()shows details about multiple comparison test as a label on the secondary Y-axis. Some themes (e.g.ggthemes::theme_fivethirtyeight()) will remove the secondary Y-axis and thus the details as well.- ...
Additional arguments to tidying method. For more, see
parameters::model_parameters().
Details
For details, see: https://indrajeetpatil.github.io/ggstatsplot/articles/web_only/ggcoefstats.html
Note
In case you want to carry out meta-analysis, you will be asked to install the needed packages (
{metafor},{metaplus}, or{metaBMA}) if they are unavailable.All rows of regression estimates where either of the following quantities is
NAwill be removed if labels are requested:estimate,statistic,p.value.Given the rapid pace at which new methods are added to these packages, it is recommended that you install development versions of
{easystats}packages using theinstall_latest()function from{easystats}.
Summary of graphics
| graphical element | geom used | argument for further modification |
| regression estimate | ggplot2::geom_point() | point.args |
| error bars | ggplot2::geom_errorbarh() | errorbar.args |
| vertical line | ggplot2::geom_vline() | vline.args |
| label with statistical details | ggrepel::geom_label_repel() | stats.label.args |
Random-effects meta-analysis
The table below provides summary about:
statistical test carried out for inferential statistics
type of effect size estimate and a measure of uncertainty for this estimate
functions used internally to compute these details
Hypothesis testing and Effect size estimation
| Type | Test | CI available? | Function used |
| Parametric | Pearson's correlation coefficient | Yes | correlation::correlation() |
| Non-parametric | Spearman's rank correlation coefficient | Yes | correlation::correlation() |
| Robust | Winsorized Pearson's correlation coefficient | Yes | correlation::correlation() |
| Bayesian | Bayesian Pearson's correlation coefficient | Yes | correlation::correlation() |
Examples
# for reproducibility
set.seed(123)
library(lme4)
#> Loading required package: Matrix
# model object
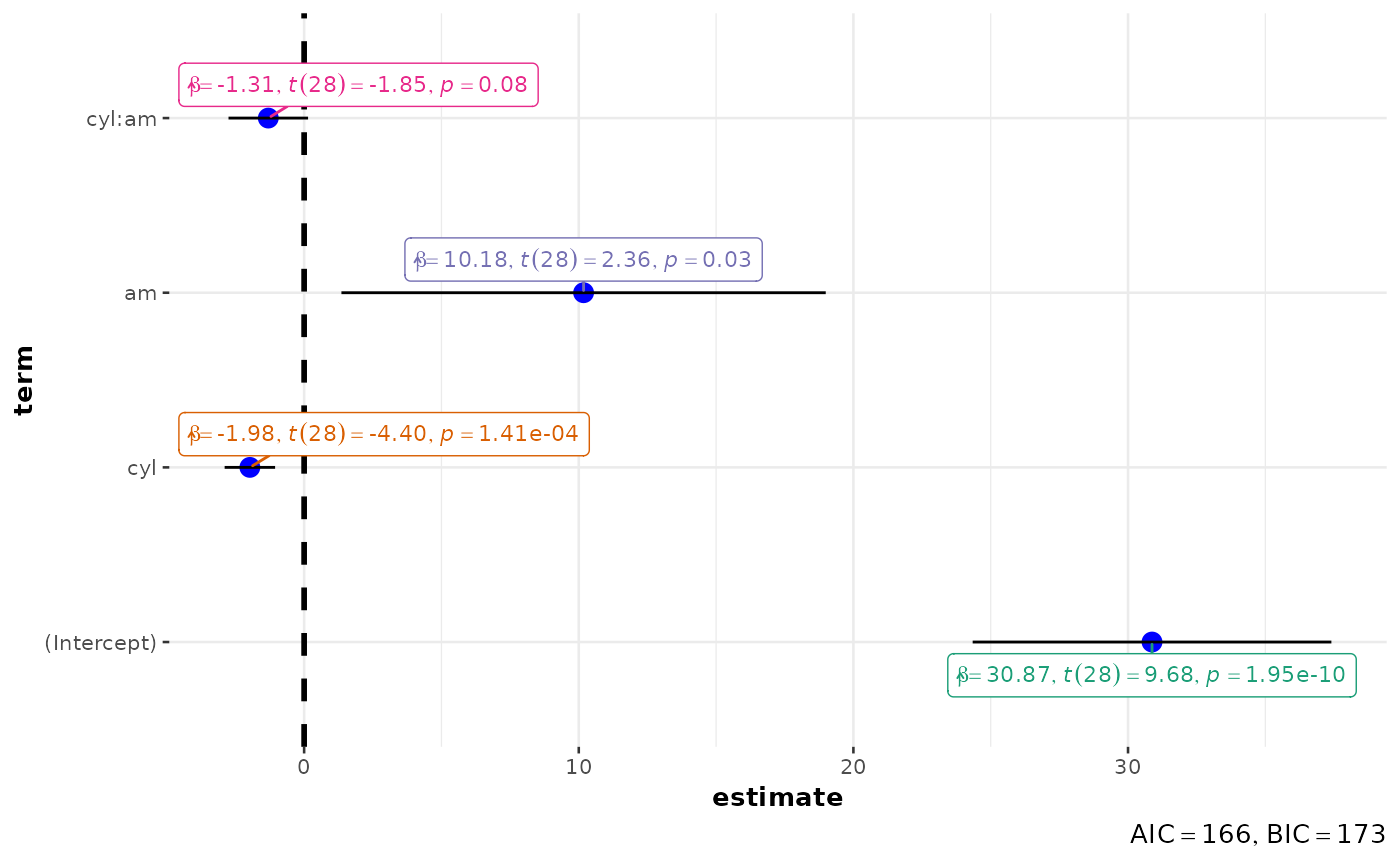
mod <- lm(formula = mpg ~ cyl * am, data = mtcars)
# creating a plot
p <- ggcoefstats(mod)
# looking at the plot
p
 # extracting details from statistical tests
extract_stats(p)
#> $subtitle_data
#> NULL
#>
#> $caption_data
#> NULL
#>
#> $pairwise_comparisons_data
#> NULL
#>
#> $descriptive_data
#> NULL
#>
#> $one_sample_data
#> NULL
#>
#> $tidy_data
#> # A tibble: 4 × 11
#> term estimate std.error conf.level conf.low conf.high statistic
#> <fct> <dbl> <dbl> <dbl> <dbl> <dbl> <dbl>
#> 1 (Intercept) 30.9 3.19 0.95 24.3 37.4 9.68
#> 2 cyl -1.98 0.449 0.95 -2.89 -1.06 -4.40
#> 3 am 10.2 4.30 0.95 1.36 19.0 2.36
#> 4 cyl:am -1.31 0.707 0.95 -2.75 0.143 -1.85
#> df.error p.value conf.method expression
#> <int> <dbl> <chr> <list>
#> 1 28 1.95e-10 Wald <language>
#> 2 28 1.41e- 4 Wald <language>
#> 3 28 2.53e- 2 Wald <language>
#> 4 28 7.55e- 2 Wald <language>
#>
#> $glance_data
#> # A tibble: 1 × 8
#> AIC AICc BIC R2 R2_adjusted RMSE Sigma expression
#> <dbl> <dbl> <dbl> <dbl> <dbl> <dbl> <dbl> <list>
#> 1 166. 168. 173. 0.785 0.762 2.75 2.94 <expression>
#>
#> attr(,"class")
#> [1] "ggstatsplot_stats" "list"
# further arguments can be passed to `parameters::model_parameters()`
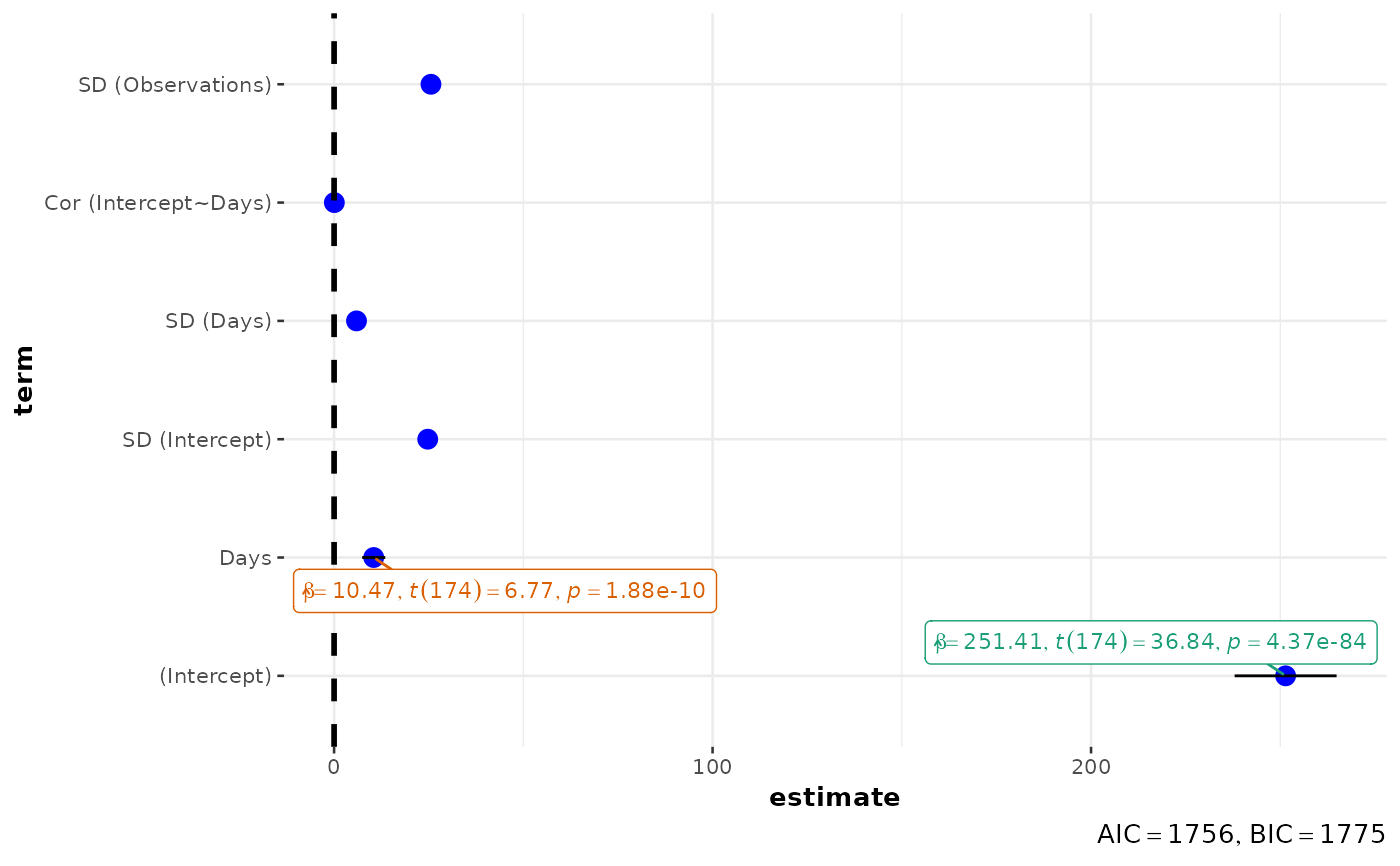
ggcoefstats(lmer(Reaction ~ Days + (Days | Subject), sleepstudy), effects = "fixed")
# extracting details from statistical tests
extract_stats(p)
#> $subtitle_data
#> NULL
#>
#> $caption_data
#> NULL
#>
#> $pairwise_comparisons_data
#> NULL
#>
#> $descriptive_data
#> NULL
#>
#> $one_sample_data
#> NULL
#>
#> $tidy_data
#> # A tibble: 4 × 11
#> term estimate std.error conf.level conf.low conf.high statistic
#> <fct> <dbl> <dbl> <dbl> <dbl> <dbl> <dbl>
#> 1 (Intercept) 30.9 3.19 0.95 24.3 37.4 9.68
#> 2 cyl -1.98 0.449 0.95 -2.89 -1.06 -4.40
#> 3 am 10.2 4.30 0.95 1.36 19.0 2.36
#> 4 cyl:am -1.31 0.707 0.95 -2.75 0.143 -1.85
#> df.error p.value conf.method expression
#> <int> <dbl> <chr> <list>
#> 1 28 1.95e-10 Wald <language>
#> 2 28 1.41e- 4 Wald <language>
#> 3 28 2.53e- 2 Wald <language>
#> 4 28 7.55e- 2 Wald <language>
#>
#> $glance_data
#> # A tibble: 1 × 8
#> AIC AICc BIC R2 R2_adjusted RMSE Sigma expression
#> <dbl> <dbl> <dbl> <dbl> <dbl> <dbl> <dbl> <list>
#> 1 166. 168. 173. 0.785 0.762 2.75 2.94 <expression>
#>
#> attr(,"class")
#> [1] "ggstatsplot_stats" "list"
# further arguments can be passed to `parameters::model_parameters()`
ggcoefstats(lmer(Reaction ~ Days + (Days | Subject), sleepstudy), effects = "fixed")